Build Your Own Kubernetes Cluster with Single-Board computers: Part 2/2

This article, continuing from the previous month, introduces a mini-PC cluster composed of multiple Raspberry Pi 4 units and RADXA ROCK 5A*¹. In the previous article, you saw the equipment used and the internal network configuration. This time, I will focus on how to configure external access to the cluster.
External access enables you to perform the remote management and to expand the range of applications. Below, you will see the specific steps and settings implemented, while paying great attention to security measures.
1.External Access
Each service running on this Kubernetes cluster is open to the public through the website of Cloudflare Tunnel*², which allows you to access services externally from any location, to manage and view even in remote environments. If you release the services, such as web services or view-only applications, to the public, while there are no security concerns, they are accessible without restrictions. Unrestricted access, however, of administrative dashboards or specific internal tools could lead to significant security risks. To mitigate the risks, Azure AD has been implemented for authentication of accessing these privileged functions. This approach safeguards confidentiality and enhances overall security.
2.Application deployment
Based on the application manifests, managed in GitHub, and through GitOps, Argo CD continuously and automatedly deploys on Kubernetes clusters. Since both Argo CD and GitHub are securely accessible from external environments. Changes in application are manageable even remotely.
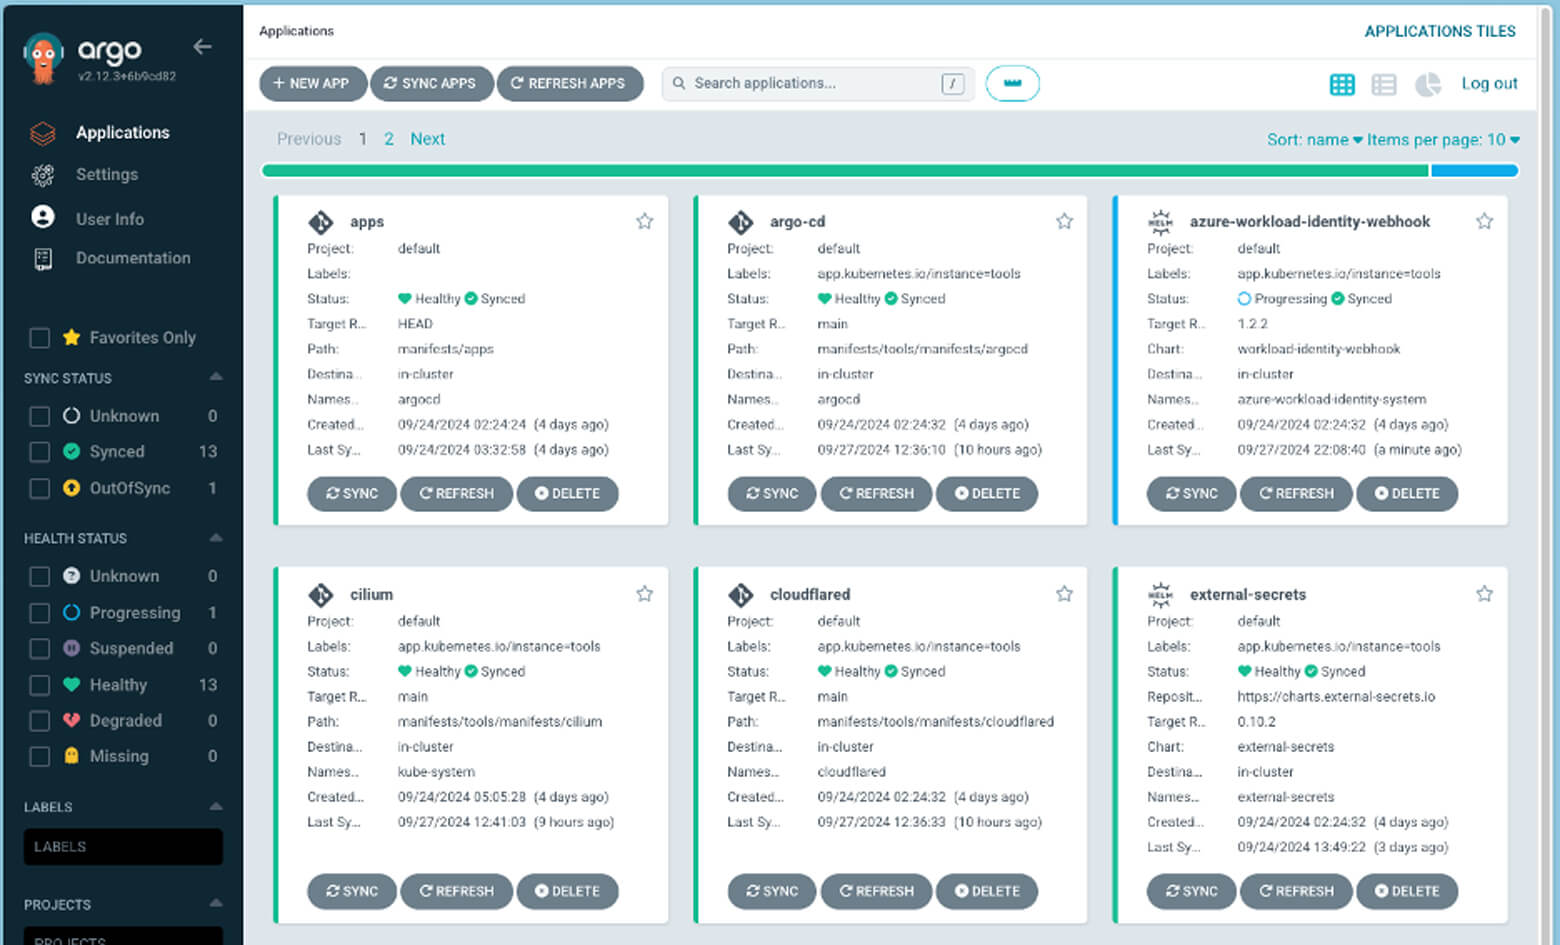
Figure 3 List of Applications on the Argo CD
3.Cluster monitoring
The environment is set up for visualizing container logs and node statuses. Promtail is selected for collecting container logs and they are stored in Loki. Prometheus is employed for gathering metrics from clusters and nodes. The collected logs and metrics are visualized using Grafana. You can check the cluster performance and status by real-time monitoring through multiple dashboards. Grafana, securely open to external access with authentication, is available for secure access from anywhere.
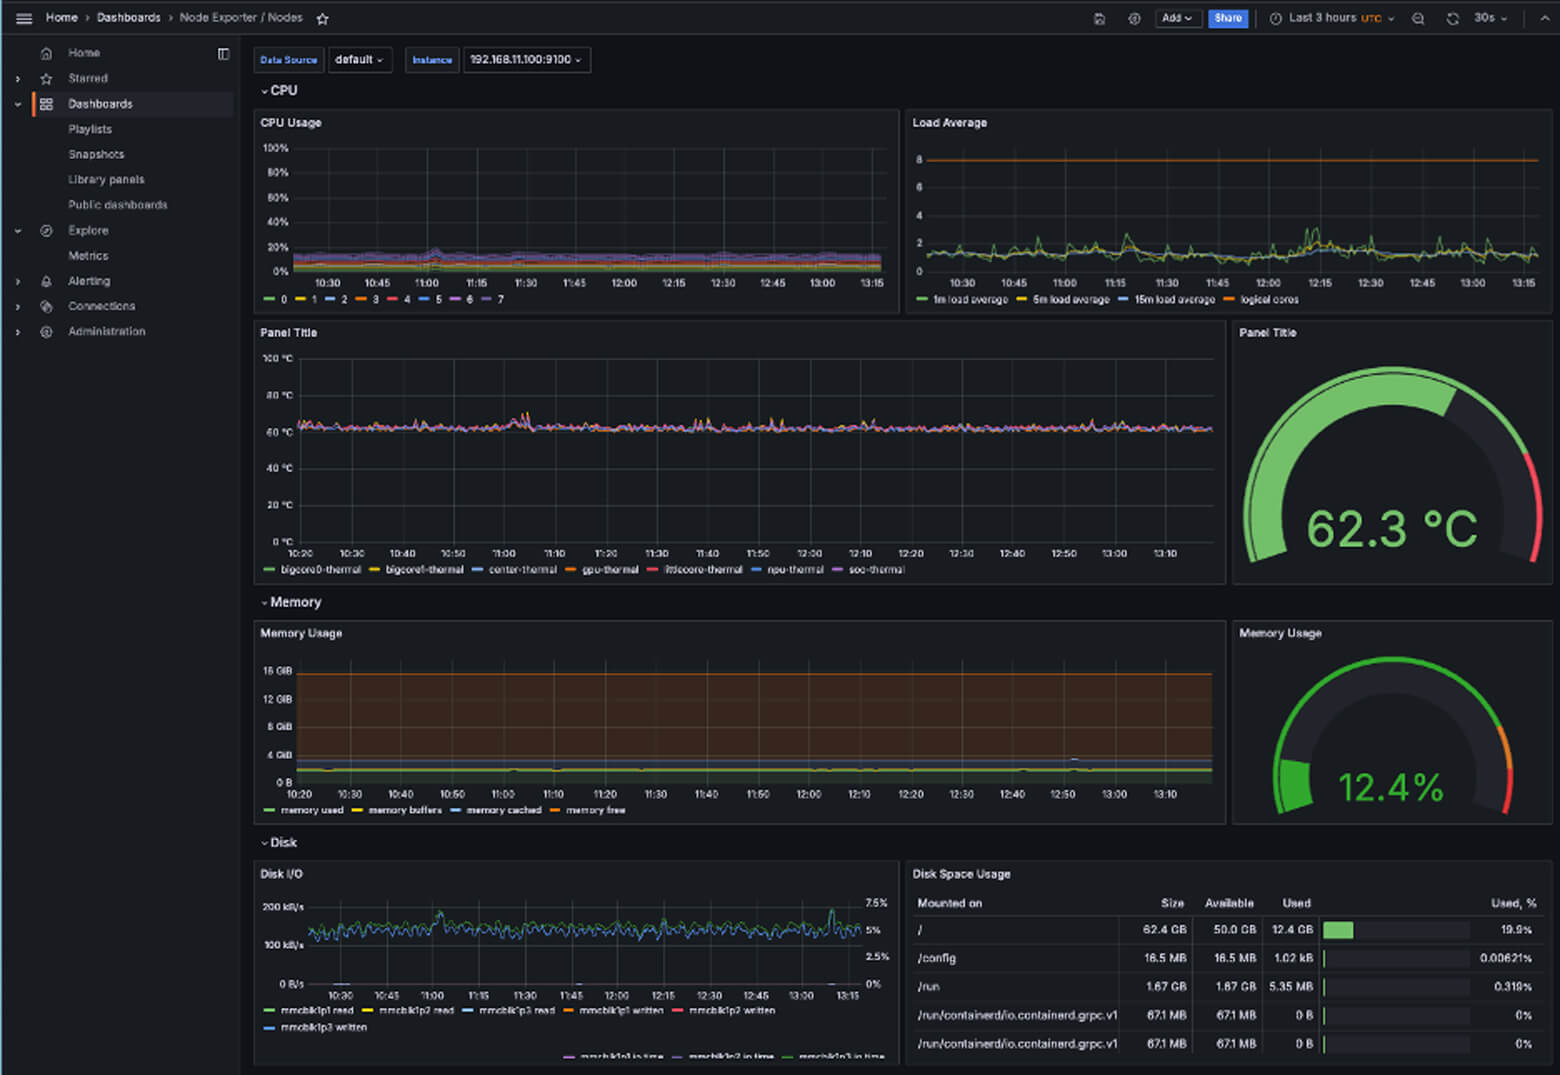
Figure 4 Grafana Dashboard Checking the Status of Each Node
4.In conclusion
I moved to a home server when I was charged significantly highly with pay-as-you-go cloud services. Avoiding financial disaster, I prefer having a more secure and flexibly manageable environment at home, which enables me to use the services with peace of mind. This motivation led me to take up this hobby. Similar to some hobbies in the world, the initial investment required a considerable amount of money, and electricity costs seem to be gradually increasing, though.
Whether it is the cloud or a home server, better performance and capabilities need costs.
I am enjoying the daily use of “my” environment. Once you build your own environment, the possibilities become limitless. If you are interested, please give it a try!
Here are the websites to which I referred to for the articles.
For more details, please go to see them:
- https://radxa.com/products/rock5/5a/ *¹Product page
- https://www.cloudflare.com/ja-jp/products/tunnel/ *²Cloudflare Tunnel details
- https://ichiken-engineering.com/rock_5a_5b_sbc_review/